
News
Quantitative Analysis of Cement by EDX-8000 (SRM 1880b, 1881a, 1884b, 1886a, 1887b, 1888b, 1889a)
High accuracy quality control analysis of cement is typically conducted using a wavelength dispersive X-ray fluorescence spectrometer. EDX instruments have become capable in recent years of analysis accuracy comparable to that of low-output wavelength dispersive type instruments. Not only do they offer such conveniences as the ability to analyze powders as they are, their range of applicability has greatly widened to include the analysis of such substances as cement. Here, we introduce the analysis accuracy obtained with pressure-formed cement standard powder samples using the new model EDX-8000.
- Sample
NIST Certificate of Analysis Standard Reference
Materials® Portland Cement
SRM 1880b, 1881a, 1884b, 1886a, 1887b, 1888b, 1889a
Table 1 shows the standard values
mass%]
|
|
SiO2 |
Al2O3 |
Fe2O3 |
CaO |
MgO |
SO3 |
K2O |
Na2O |
|
1880b |
20.42 |
5.183 |
3.681 |
64.16 |
1.176 |
2.710 |
0.646 |
0.091 |
|
1881a |
22.26 |
7.060 |
3.090 |
57.58 |
2.981 |
3.366 |
1.228 |
0.199 |
|
1884b |
19.30 |
4.851 |
2.937 |
61.31 |
4.740 |
4.034 |
0.957 |
0.278 |
|
1886a |
22.38 |
3.875 |
0.152 |
67.87 |
1.932 |
2.086 |
0.093 |
0.021 |
|
1887b |
19.59 |
4.911 |
2.471 |
61.15 |
3.624 |
4.599 |
0.961 |
0.288 |
|
1888b |
20.42 |
4.277 |
3.062 |
63.13 |
3.562 |
2.634 |
0.658 |
0.136 |
|
1889a |
20.66 |
3.89 |
1.937 |
65.34 |
0.814 |
2.690 |
0.605 |
0.195 |
- Sample Preparation
Pressure forming was conducted using a vinyl chloride ring (inner diameter 35 mmф ), with a total pressure of 250 kN for 60 seconds. A photograph of the sample is shown in Fig. 1.
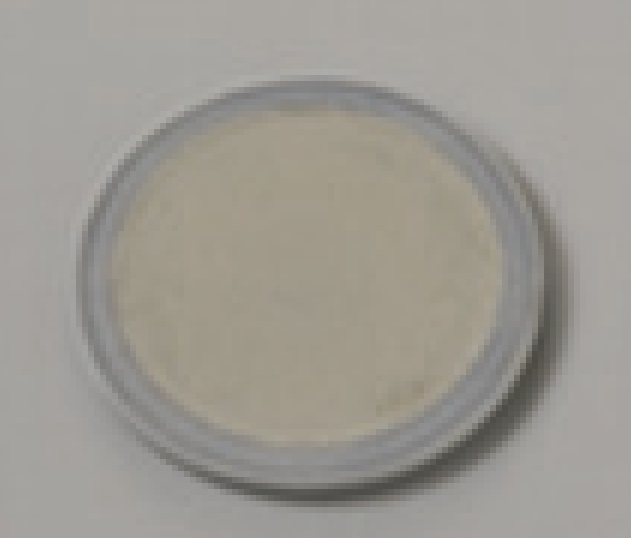
Fig. 1 Pressure-Formed Briquette of Cement
- Calibration Curves
The calibration curve and accuracy (1σ) for each element are shown in Fig. 2.
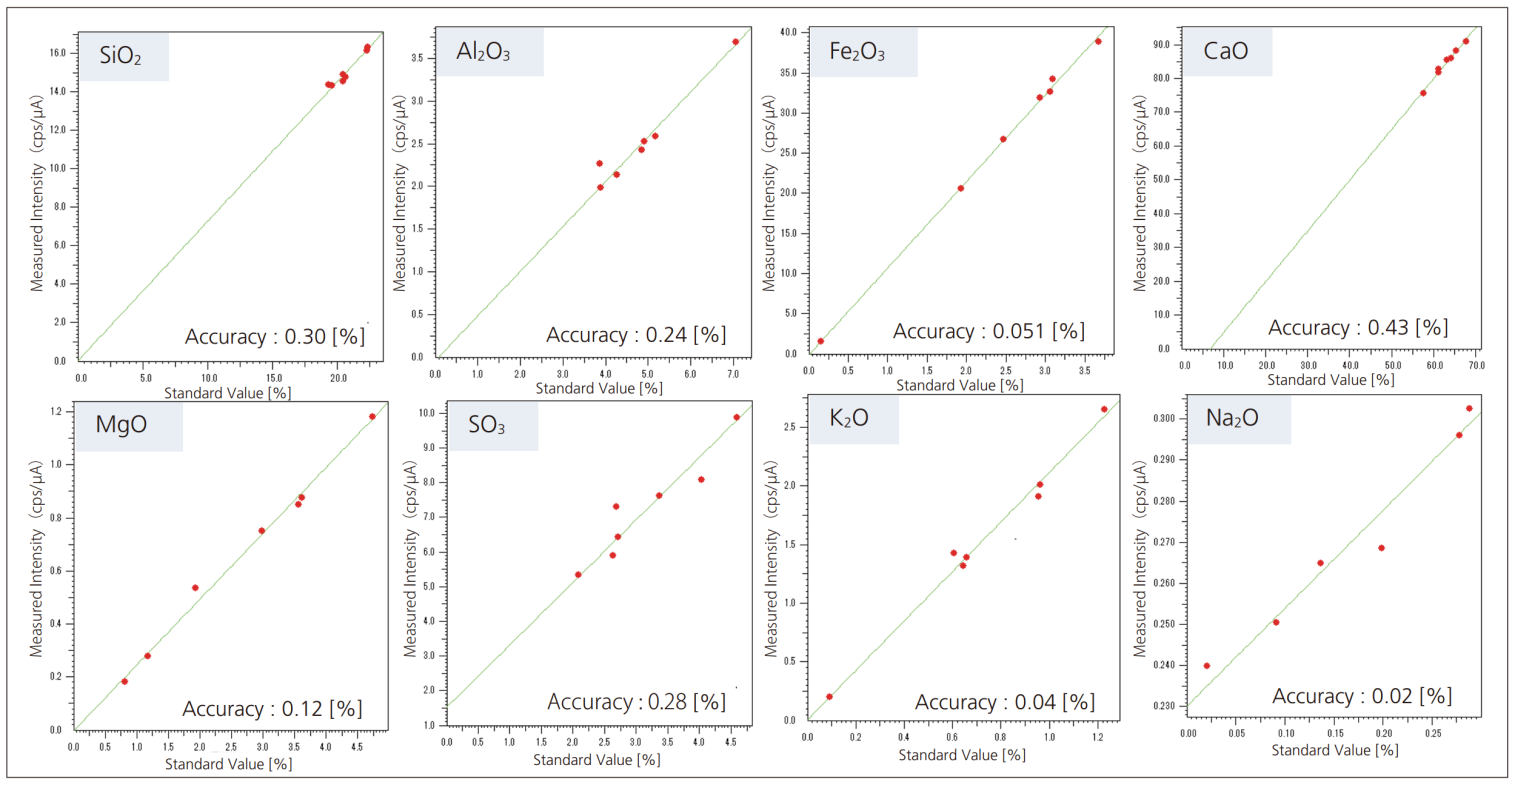
Fig. 2 Calibration Curves and Accuracy
- Lower Limits of Detection (L.L.D.)
The lower limits of detection calculated using the above calibration curves are shown in Table 2.
Table 2 Lower Limits of Detection (300 sec, 100 sec only for Fe2O3
[mass%]
|
|
SiO2 |
Al2O3 |
Fe2O3 |
CaO |
MgO |
SO3 |
K2O |
Na2O |
|
Lower Limit of Detection (LLD) |
- |
0.0083 |
0.0022 |
- |
0.0157 |
0.0066 |
0.0049 |
0.0159 |
- Repeatability
Using the above calibration curve method, the repeatability test results for SRM 1880b shown in Table 3 were obtained by simply conducting 10 repeat measurements. The X-ray fluorescence spectra for each measurement element of each sample are shown in Fig. 3.
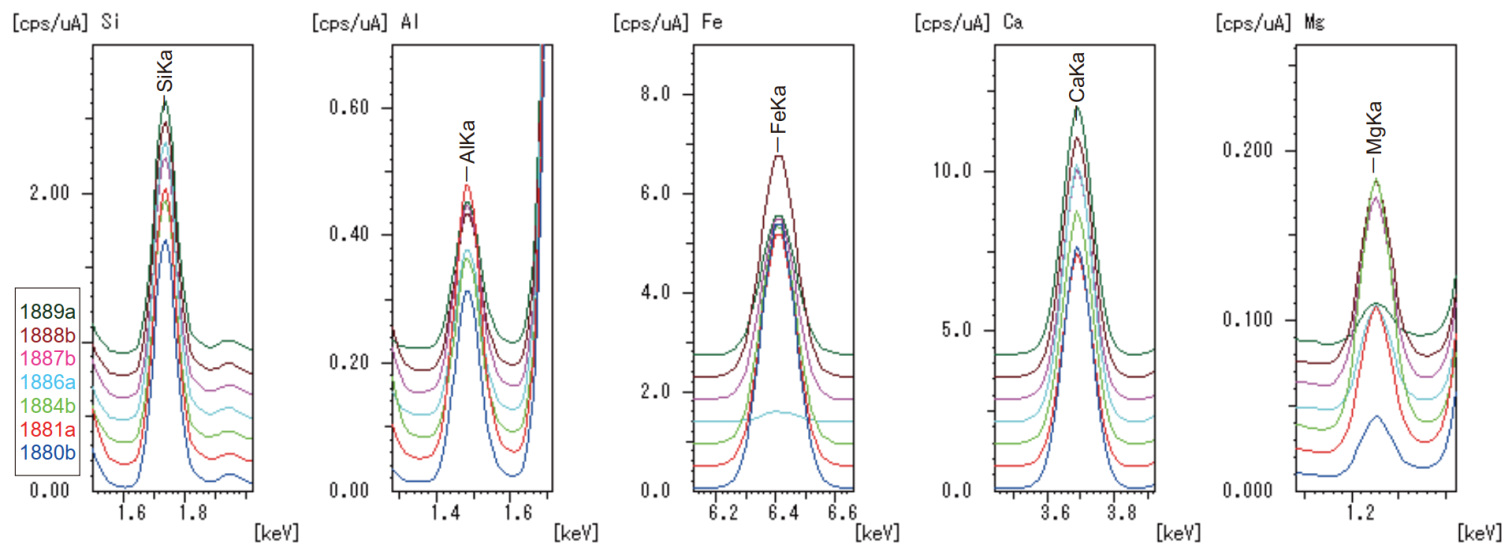
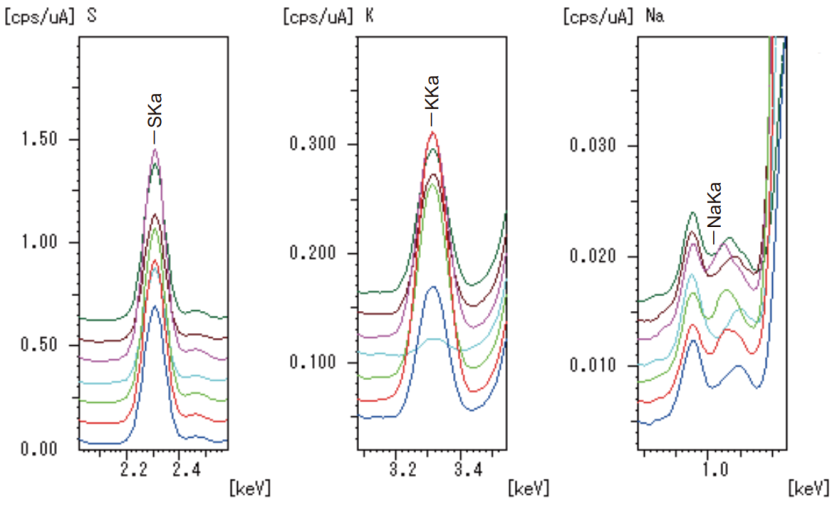
Fig. 3 X-Ray Fluorescence Spectra of Measured Elements
Table 3 Repeatability for SRM 1880b (300 sec, 100 sec only for Fe2O3)
[mass%]
|
|
SiO2 |
Al2O3 |
Fe2O3 |
CaO |
MgO |
SO3 |
K2O |
Na2O |
|
1 |
20.09 |
5.032 |
3.615 |
64.12 |
1.088 |
2.729 |
0.622 |
0.100 |
|
2 |
20.05 |
5.031 |
3.609 |
64.15 |
1.087 |
2.740 |
0.621 |
0.098 |
|
3 |
20.04 |
5.043 |
3.615 |
64.18 |
1.087 |
2.736 |
0.612 |
0.107 |
|
4 |
20.01 |
5.022 |
3.625 |
64.16 |
1.089 |
2.738 |
0.616 |
0.105 |
|
5 |
19.96 |
5.038 |
3.618 |
64.18 |
1.148 |
2.744 |
0.620 |
0.100 |
|
6 |
20.02 |
5.045 |
3.625 |
64.18 |
1.094 |
2.744 |
0.615 |
0.114 |
|
7 |
20.11 |
5.052 |
3.630 |
64.18 |
1.157 |
2.743 |
0.616 |
0.110 |
|
8 |
20.09 |
5.037 |
3.628 |
64.17 |
1.174 |
2.740 |
0.619 |
0.112 |
|
9 |
19.98 |
5.032 |
3.631 |
64.17 |
1.101 |
2.741 |
0.616 |
0.109 |
|
10 |
20.14 |
5.040 |
3.614 |
64.21 |
1.158 |
2.745 |
0.621 |
0.100 |
|
Average |
20.05 |
5.037 |
3.621 |
64.17 |
1.118 |
2.740 |
0.618 |
0.105 |
|
Standard Deviation |
0.059 |
0.008 |
0.008 |
0.025 |
0.036 |
0.005 |
0.003 |
0.006 |
|
Coefficient of Variation [%] |
0.30 |
0.17 |
0.22 |
0.04 |
3.2 |
0.17 |
0.52 |
5.5 |
Source: ETA
Others
- TECOTEC GROUP ATTENDED SHIMADZU’S SERVICE MANAGER MEETING IN 2022
- TECOTEC HANDED OVER EDX-7000 X-RAY FLOURESCENCE SPECTROMETER AT NIDEC CHAUN CHOUNG VIETNAM
- INSTALLATION OF CHIP PROCESSING SYSTEM – LANNER/ GERMANY
- TECOTEC completed installation of EDX-LE Energy dispersive X-ray Fluorescence spectrometer at DYT Vina
- TECOTEC DELIVERED AND INSTALLED THE 2ND X-RAY FLUORESCENCE SPECTROMETER - EDX-LE PLUS AT TABUCHI
- TECOTEC Group has handed over PDA-7000 Optical Emissions Spectrometers for Nihon Plast Vietnam
- Bowman XRF Coating Measurement System For Electroless Nickel Plating
- TECOTEC DELIVERED AND INSTALLED SMX-2000 SYSTEM TO NIDEC TECHNO MOTOR VIETNAM