
News
WHAT’S THE DIFFERENCE BETWEEN JITTER AND NOISE?
The terms noise and jitter can mistakenly be confused, even more so as data rates and signal amplitudes have changed over time. They are distinct in nature, though, and good analysis tools can identify, isolate, and mitigate them.This feature will explain the root causes of jitter and noise, and how to leverage that understanding to perform better high-speed signal analysis.
Definitions of Jitter and Noise
Let’s start with the basic definitions. Jitter is the variation in a signal’s timing from its nominal value. Jitter will manifest itself as variations in phase, period, width, or duty cycle. Noise is the variation of a signal’s amplitude from nominal. Both noise and jitter can cause transmission errors and increase the bit error rate of a serial link.
Originally, testing of serial data links focused on characterizing and minimizing timing jitter because serial data amplitudes were relatively high. However, as serial data rates increased, signal amplitudes were being reduced, so noise became more of an issue. Noise and jitter become entangled when noise migrates into timing jitter whenever the signal crosses a logic threshold. Consider the situation shown (Fig. 1).
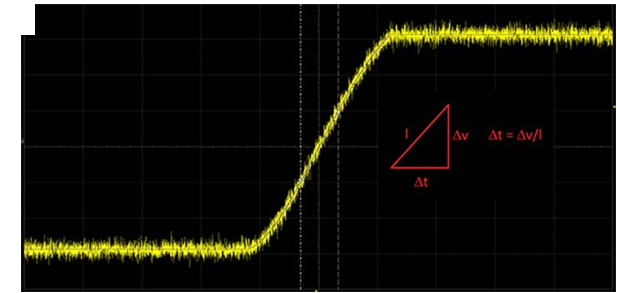
The signal has additive vertical noise. If applied to a logic gate, the logic threshold is crossed earlier or later depending on the instantaneous amplitude of the noise. The effect on the output time shift (Δt) depends directly on the noise amplitude (Δv) and inversely with the nominal slope (l) of the signal edge, as illustrated.
Wide-bandwidth digital oscilloscopes are used to make signal-integrity measurements on high-speed serial data links. Suppliers offer a number of serial-data-analysis options that characterize signal integrity by extracting jitter and noise and extrapolating their effects to predict bit error rates.
Serial Data Analysis
Consider the analysis on an oscilloscope using a serial-data-analysis program (Fig. 2). An expanded view of the 2.48-GHz serial data signal is shown in the upper left display.
Jitter and noise can come from a variety of sources. They may be categorized broadly as having random or deterministic components. Deterministic components can be further defined as periodic, data-dependent, or bounded uncorrelated to the signal.
Knowledge of the type and magnitude of these components helps to identify their source, which is where the software steps in. Using a variety of methods, it separates the various noise and jitter components, and by extrapolating this data it can predict, based on limited measurement record length, the bit error rates out to 1012 bits.
The two traces below the input signal are the noise-track and jitter-track signals, respectively. The track signals show the noise and jitter separated from the source signal; they are part of the isolation process that takes place in the analysis software.

The upper right grid of Fig. 2 displays an eye diagram. The eye opening represents signal quality in this diagram by the eye opening. Jitter tends to close the eye horizontally and noise closes it vertically.
The deterministic noise and jitter components are bounded; that is, they do not increase with increasing time or number of measurements. Their effect on the eye is predictable. Deterministic components are measured in the frequency domain by taking the fast Fourier transform (FFT) of the noise or jitter.
Random components are unbounded and increase with increasing time. Histograms of both random noise and jitter components, shown in the right-hand grids, second and third from the top, respectively, are used to predict the random components out to the desired number of measurements (generally the aforementioned 1012 bits) using statistical extrapolation techniques.
A bathtub plot is shown on the same grid with the jitter histogram. The bathtub curve shows horizontal eye opening as a function of number of measurements. Random jitter components affect the slope of the curves and deterministic jitter affects the horizontal location.
Beneath the graphical display is a table containing noise and jitter measurement parameters. They read the total noise or jitter and the amplitudes of the random and deterministic components. A third row in the table reads the key eye-diagram parameters.
Both noise and jitter affect serial-data bit error rates. As manifested on an eye diagram, noise can affect both vertical and horizontal eye closure. Jitter affects the horizontal closure. Special analysis software is able to isolate, process and measure noise and jitter components, making it possible to predict bit error rates for any number of serial bits.
The major suppliers of wide-bandwidth digital oscilloscopes all offer serial-data-analysis software packages that measure noise and jitter components.
Source: RSI
Others
- TECOTEC GROUP ATTENDED SHIMADZU’S SERVICE MANAGER MEETING IN 2022
- TECOTEC HANDED OVER EDX-7000 X-RAY FLOURESCENCE SPECTROMETER AT NIDEC CHAUN CHOUNG VIETNAM
- INSTALLATION OF CHIP PROCESSING SYSTEM – LANNER/ GERMANY
- TECOTEC completed installation of EDX-LE Energy dispersive X-ray Fluorescence spectrometer at DYT Vina
- TECOTEC DELIVERED AND INSTALLED THE 2ND X-RAY FLUORESCENCE SPECTROMETER - EDX-LE PLUS AT TABUCHI
- TECOTEC Group has handed over PDA-7000 Optical Emissions Spectrometers for Nihon Plast Vietnam
- Bowman XRF Coating Measurement System For Electroless Nickel Plating
- TECOTEC DELIVERED AND INSTALLED SMX-2000 SYSTEM TO NIDEC TECHNO MOTOR VIETNAM