
News
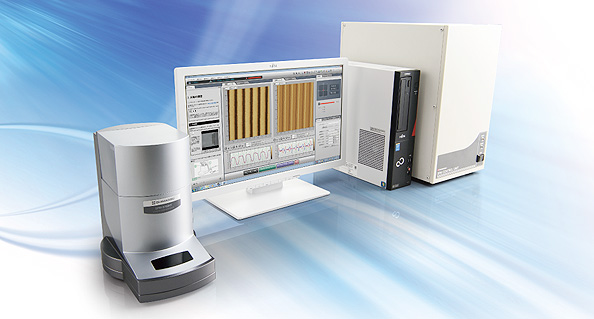
SPM-9700 – Nano scanning probe Microscope
This best-selling model features a contact mode and dynamic mode (by frequency modulation). With extensive functionality and expandability, it is capable of meeting a diverse range of requirements. The revolutionary software interface ensures that the operations for everything from observation to data analysis can be performed with confidence.
Nano 3D Mapping
Visualizing the Physical Properties of Nano-Regions on Surface or Interface
The physical properties of external or boundary surfaces can be evaluated by measuring the force acting on a scanning probe microscope cantilever probe as its distance from the sample is varied (force curve measurement).
Key Features
- The adhesive force and Young's modulus can be evaluated at a specific target location by measuring the force curve at that point (point analysis).
- By acquiring force curves at multiple points, a two-dimension map of the physical properties can be created (mapping analysis).
- Acquired data can be displayed three-dimensionally, or specific data can be extracted for data analysis (3D analysis).
- Quantitative Young's modulus values can be calculated from a theoretical model.
Evaluating Physical Properties at Any Point on a Film
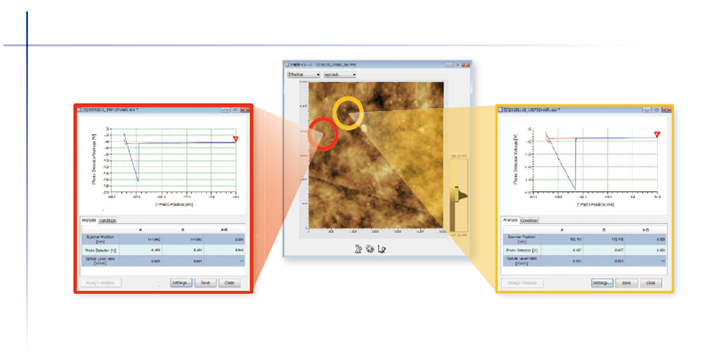
Force curves were measured at arbitrary points on a film surface. The results show that the adhesive force is different at the respective points.
Similarly, physical properties can also be evaluated on small soft samples, such as biopolymers.
3D Analysis
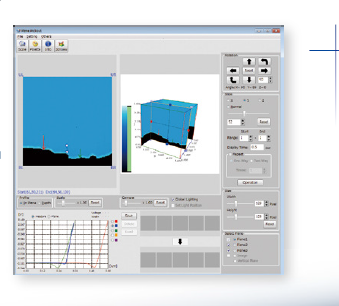
All force curves acquired for mapping are saved. Therefore, the data can be displayed three-dimensionally, or specific cross sections can be extracted for data analysis.
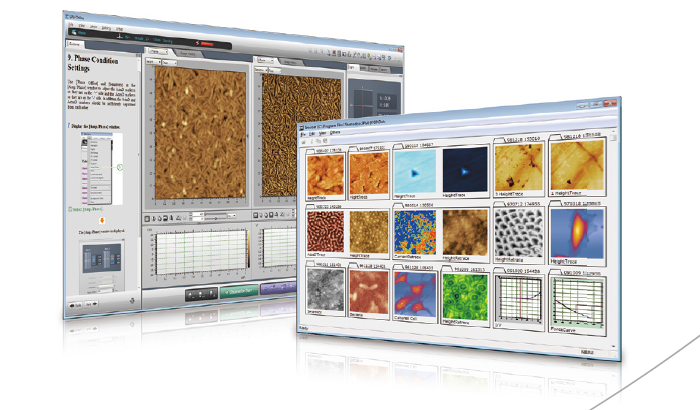
Mapping the Physical Properties of Plastic Films
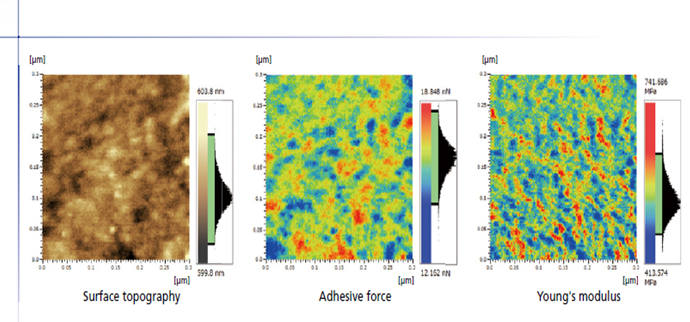
Mapping analysis can be used to measure adhesive force and Young's modulus as well as surface topography. The figure shows a quantitative visualization of the Young's modulus within a localized area only 300 nm wide on a plastic film surface. (Sample source: MORESCO).
Application example: Evaluating the uniformity of a polymer material surface
Adhesive Part of an Adhesive Tape
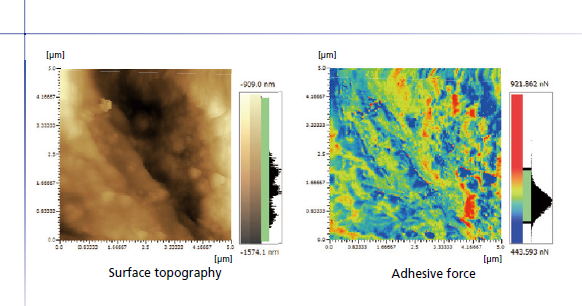
These images are from an evaluation of the adhesive part of an adhesive tape. They show that the adhesive force is distributed non-uniformly. This demonstrates how the system can be used to evaluate adhesive properties, which were difficult to evaluate using conventional methods.
Application example: Evaluating the localized adhesive properties of thin films.
Main Specications
Force Cure
|
Measurement |
Scan (Z) range |
Settings method |
Specify end point and width, and automatically track end point |
|
Range |
Depends on scanner |
||
|
Scanning speed |
Frequency setting |
0.1 to 100Hz |
|
|
Frequency setting step size |
0.1Hz |
||
|
XY movement |
Settings method |
Numerical entry, or specied with mouse on SPM image |
|
|
Range |
Depends on scanner |
||
|
Display |
SPM image data, force curve waveform, measurement parameters, and data analysis results |
||
Mapping
|
Measurement |
Physical quantities measured |
Adsorption force, slope of force curve, Z-position, or elastic modulus |
|
Range |
Depends on scanner |
|
|
Resolution |
512×512, 256×256, 128×128, 64×64, 32×32, 16×16, 8×8, 4×4, 2×2 |
|
|
Display |
SPM image data, force curve waveform, and measurement parameters |
|
Source: ETA
Others
- TECOTEC GROUP ATTENDED SHIMADZU’S SERVICE MANAGER MEETING IN 2022
- TECOTEC HANDED OVER EDX-7000 X-RAY FLOURESCENCE SPECTROMETER AT NIDEC CHAUN CHOUNG VIETNAM
- INSTALLATION OF CHIP PROCESSING SYSTEM – LANNER/ GERMANY
- TECOTEC completed installation of EDX-LE Energy dispersive X-ray Fluorescence spectrometer at DYT Vina
- TECOTEC DELIVERED AND INSTALLED THE 2ND X-RAY FLUORESCENCE SPECTROMETER - EDX-LE PLUS AT TABUCHI
- TECOTEC Group has handed over PDA-7000 Optical Emissions Spectrometers for Nihon Plast Vietnam
- Bowman XRF Coating Measurement System For Electroless Nickel Plating
- TECOTEC DELIVERED AND INSTALLED SMX-2000 SYSTEM TO NIDEC TECHNO MOTOR VIETNAM