
News
HOW TO MAKE A GREAT OSCILLOSCOPE MEASUREMENT (PART 1)
In oscilloscopes today, making a good signal measurement is easy. However, making a great measurement takes some expertise. As edge speeds increase and voltages decrease, your signal’s margin of error becomes smaller and smaller. Digital oscilloscopes have turned manual measurements into an automated process, allowing you to make adequate measurements quickly and easily. However, turning that good measurement into a great measurement requires a little extra knowledge and effort. Following some key best practices will give you much higher accuracy and confidence in your measurements. Signal scaling and bits of resolution will impact the quality of your measurement, so it’s crucial to understand how to get the most out of your oscilloscope.
Start by Making a Good Measurement
First, set up your scope to make a measurement. Simply press the “Measure” button on the front of your oscilloscope. The scope will then automatically display the requested measurement on the screen. You can configure the scope to modify the measurement parameters, track the measurement with cursors, and even display measurement statistics. To improve the quality of this measurement, consider the following best practices.
Signal Scaling
Horizontal scaling
Horizontal scaling is important to consider when making time-dependent measurements. When you change the horizontal scaling (time-per-division) of your signal, you’re also changing the total signal-acquisition time.
Signal-acquisition time in turn affects the sample rate of the scope. This relationship is described by the equation:
Sample Rate = Memory Depth/Acquisition Time
Memory depth is a fixed value, and the acquisition time is fixed by adjusting the time-per-division setting on your oscilloscope. As the acquisition time increases, the sample rate will have to decrease in order to fit the entire acquisition into the scope’s memory. Having an appropriate sample rate for time-dependent measurements (frequency, pulse width, rise time, etc.) is important.
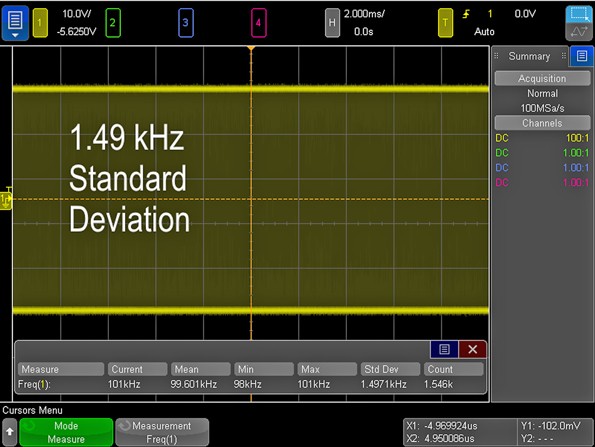
For example, take a frequency measurement of a known 100-kHz clock signal (Fig. 1). At 2 ms/division, we can see that the frequency measurement has an average of 99.6 kHz with a standard deviation of 1.48 kHz. Based on the standard deviation value, this gives us a measurement accuracy of about 1.5%. Notice that the sample rate is 100 Msamples/s due to the larger time-per-division setting of the scope.
Looking at the exact same 100-kHz clock signal at 1.2 µs/division instead of 2 ms/division (Fig. 2), we see that the average measured frequency is 100.00 kHz and the standard deviation is 1.53 Hz. This gives us measurement accuracy of around 0.001%. Also note that the sample rate is 5 Gsamples/s, which is the maximum sample rate for the Keysight InfiniiVision 4000 X-Series oscilloscope being used.
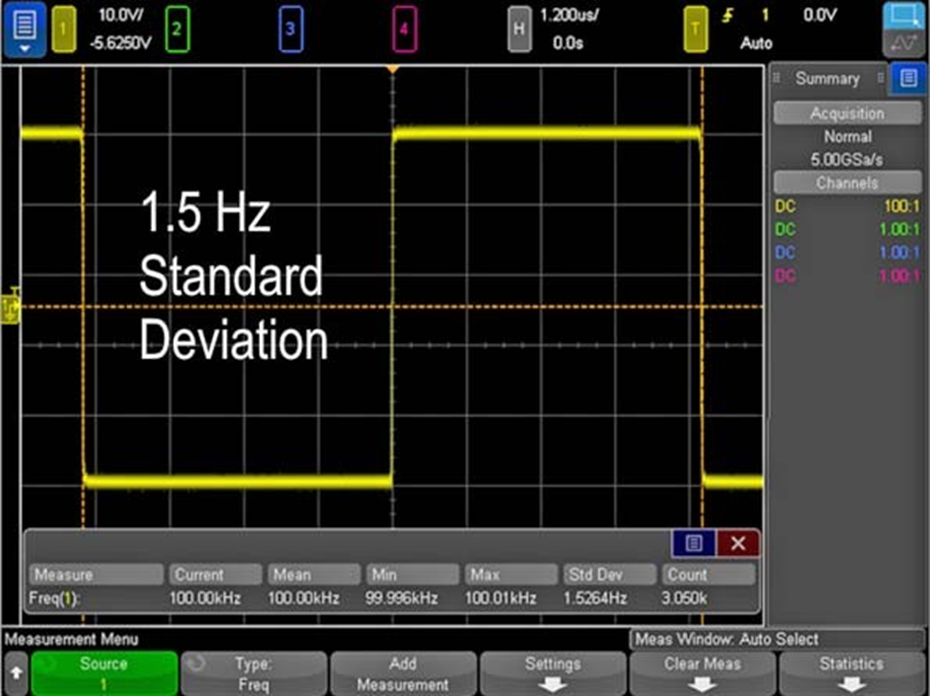
By horizontally scaling the signal to only show about one period, we were able to maximize the sample rate and improve the standard deviation of our frequency measurement by a factor of 1000. While 99.6 kHz was a good measurement, our knowledge of horizontal-scaling techniques enabled us to make a measurement three orders of magnitude more accurate.
Vertical Scaling
Just as horizontal scaling is important for time-specific measurements, vertical scaling is important for vertically dependent measurements (peak-to-peak, RMS, max, min, etc.).
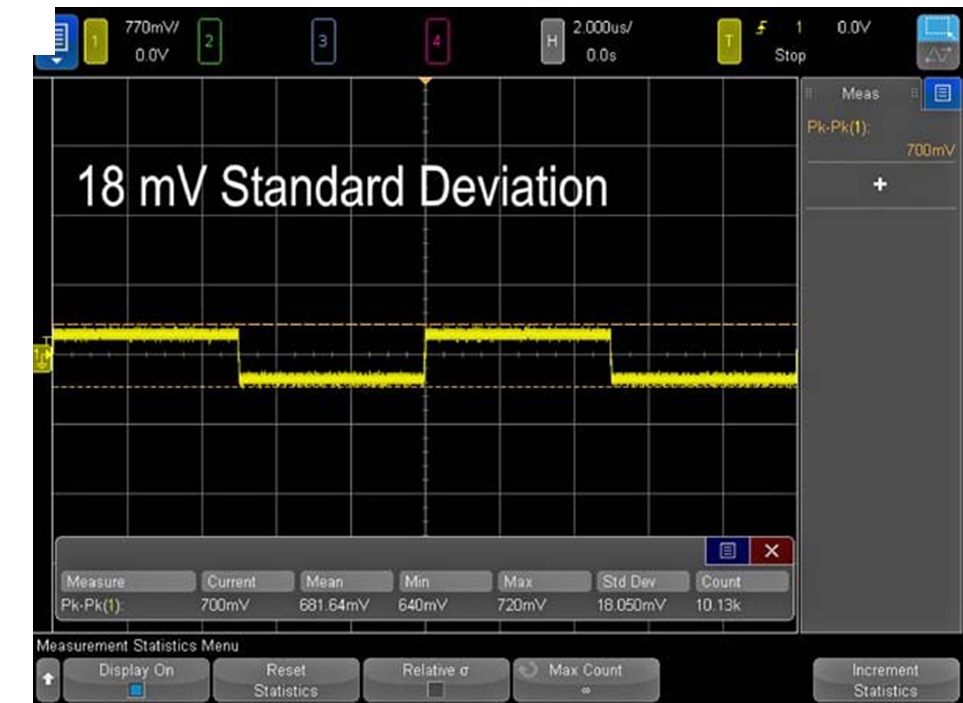
Take, for example, the same 100-kHz clock signal we discussed for horizontal scaling. This time we will look at a peak-to-peak voltage measurement (Fig. 3). At 770 mV/division, we see that the average VPP value is 681 mV and the standard deviation is 18.1 mV.
By simply increasing the voltage-per-division scaling (Fig. 4), the average value becomes 512.5 mV and the standard deviation becomes 1.2 mV.
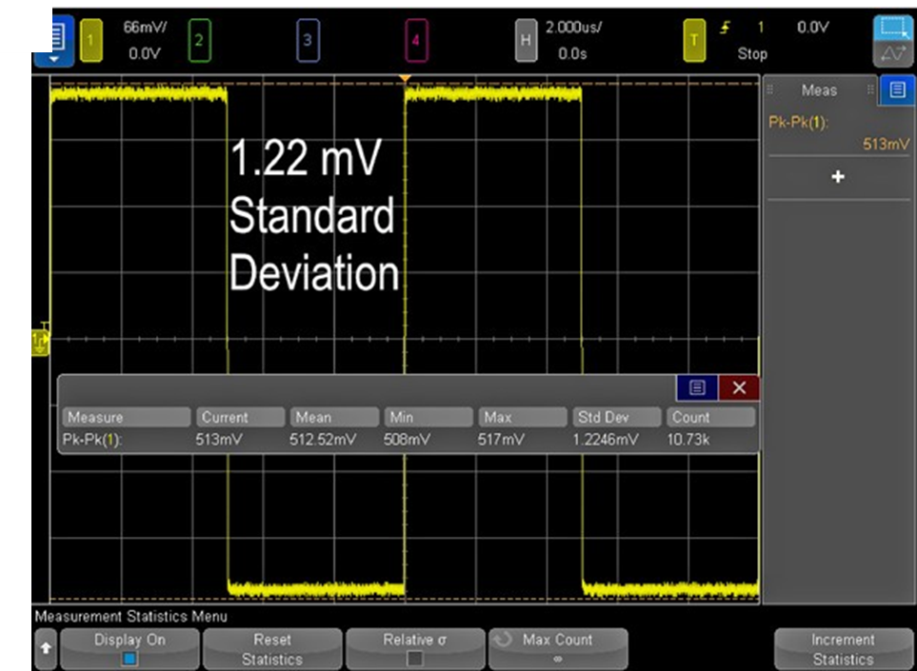
Increasing the vertical scaling of the signal enabled a much more accurate VPP measurement with a standard deviation that’s 15 times smaller. Why does the vertical scaling have an effect on the measurements? Just as horizontal (time-dependent) measurements are affected by sample rate, vertical (amplitude-dependent) measurements are affected by bits of resolution.
Source: RSI
Others
- TECOTEC GROUP ATTENDED SHIMADZU’S SERVICE MANAGER MEETING IN 2022
- TECOTEC HANDED OVER EDX-7000 X-RAY FLOURESCENCE SPECTROMETER AT NIDEC CHAUN CHOUNG VIETNAM
- INSTALLATION OF CHIP PROCESSING SYSTEM – LANNER/ GERMANY
- TECOTEC completed installation of EDX-LE Energy dispersive X-ray Fluorescence spectrometer at DYT Vina
- TECOTEC DELIVERED AND INSTALLED THE 2ND X-RAY FLUORESCENCE SPECTROMETER - EDX-LE PLUS AT TABUCHI
- TECOTEC Group has handed over PDA-7000 Optical Emissions Spectrometers for Nihon Plast Vietnam
- Bowman XRF Coating Measurement System For Electroless Nickel Plating
- TECOTEC DELIVERED AND INSTALLED SMX-2000 SYSTEM TO NIDEC TECHNO MOTOR VIETNAM